

The world of data presentation is changing. One specific area where this change is seen is in the shift from traditional chart types to more advanced forms of data representation like combination charts. Visualizing data in a way that is easy to comprehend and makes sense to the audience has never been more critical. Keep reading to learn more about these chart types.
Unraveling the Mystery of Combination Charts
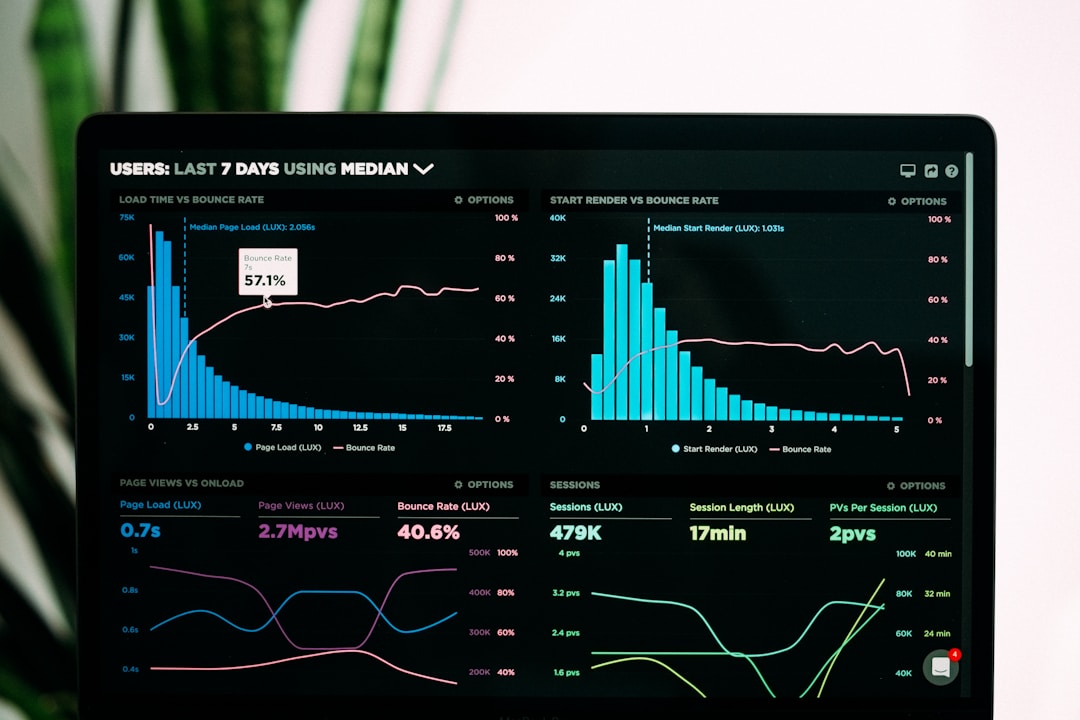
Combination charts, as the name suggests, combine different types of graphs into one chart. In essence, a combination chart is a hybrid of two or more types of charts, typically a line chart and a column chart. They aim to align different kinds of data on a single graph for better comparison and analysis.
This type of visual representation allows you to picture complex issues in an easier, more digestible way. It provides various angles for exploring and interpreting data, thanks to different data sets being displayed in unique chart styles.
For instance, you could be showing the revenue growth over the years (depicted by a line graph) together with the inflation rate (illustrated by a bar graph). The interplay of different charts leads to a more comprehensive understanding.
Basics of Combination Charts
Combination charts typically involve numerical data and time series – which is why they are perfect for financial and statistical analysis, among other fields. However, they can potentially be used with other types of data as well. The flexibility inherent to combination charts makes them particularly versatile and adaptable.
The primary component of a combination chart is its axes – the vertical and horizontal lines. The vertical axis is typically used to measure numerical values, while the horizontal axis commonly represents time.
What differentiates combination charts from others is the fact that they can have more than one vertical axis. This allows the comparison of data points that may be on different scales – but can still be compared within a unified timeframe.
Each chart type within the combination chart (such as a line or column) is usually represented by a separate series – thereby allowing a variety of data types to be displayed simultaneously.
Different Components of Combination Charts
The corresponding relationship between the axes (vertical and horizontal) and the juxtaposed chart types creates a unique visual layout. Each type of chart within the combination represents different data, subtly reinforcing their interrelationships and differences.
While the first data series may be presented as a column chart illustrating revenue growth in a bar format, the second data series might take the form of a line chart displaying inflation rates over the years.
What makes these charts particularly interesting is the fluid integration between their components. Not only do they provide detailed data analysis, but they also highlight correlations, anomalies, and patterns among different data sets.
Generating insights that couldn’t be obtained individually, combination charts form a holistic scenario that makes comprehensive understanding and decision-making easier.
Advantages of Using Combination Charts For Data Analysis

In the world of data analysis, the efficiency of data-driven decision-making fundamentally depends on the clarity and comprehensibility of the data. Combination charts help facilitate better decision-making by providing a cohesive and concise view of the data.
Their flexibility in combining different chart types enables versatile data analysis – from comparing data series to identifying minute discrepancies and patterns. Furthermore, combination charts can represent complex data more clearly and understandably. They conserve space by consolidating multiple graphs into one, increasing readability and simplicity.
Moreover, the use of combination charts aids in producing a comprehensive hypothesis about the data, leading to more informed decisions.
Altogether, combination charts are an invaluable tool for data visualization and interpretation. Utilize them appropriately, and your data analysis endeavors will be all the more efficient and impactful. Remember to keep the charts simple, clear, and relevant to make the most out of them!


